So, something I had to do recently was to set up monitoring for a couple of specific Windows processes, so that we get notification via a Discord channel if those processes are not running on various hosts.
Typically, you’d do this with something like NSClient++ but this was proving to be too problematic and time-consuming to get the client side configured and working correctly.
So, I decided to try a different approach to keep things quick and simple. However, things turned out to be neither quick nor simple. I’ll save the rant, needless to say I generally leave managing our Windows hosts to our Windows people. I haven’t used Windows since ‘98. I typically steer clear, and I’m not even sure why I took this on, or why I’m writing this up. I hope it helps someone else, but I personally hope never to have to come back here!
My assessment of the requirement suggested that all that is really needed here is an endpoint the monitoring server can contact that would return ‘OK all is well’ or ‘ERROR your process isn’t running’ as text responses. I wanted to do this with tools already available on Windows if possible, without having to download and install any third-party agents or libraries. As far as I know, that pretty much means Powershell. So, I took a deep breathe and rolled up my sleeves…
Try {
    $listener = New-Object System.Net.HttpListener
    $listener.Prefixes.Add("http://+:8123/")
    $listener.Start()
} Catch {
    Write-Host "Failed to configure or start listener: $($_.exception.message)"
    Exit 1
}

while($listener.IsListening) {
	$listenerContext = $listener.GetContext()
	$process = $listenerContext.Request.Url.LocalPath -replace "/",""

    $running = Get-Process $process -ErrorAction SilentlyContinue

    if($running) {
	    $Content = [System.Text.Encoding]::UTF8.GetBytes("OK - $($process) is running")
    }
    else {
	    $Content = [System.Text.Encoding]::UTF8.GetBytes("ERROR - $($process) is not running")
    }

	$listenerContext.Response.ContentType = "text/plain"
	$listenerContext.Response.OutputStream.Write($Content, 0, $Content.Length)
	$listenerContext.Response.Close()

	#$listener.Stop()
}
That needs to go in a file somewhere, such as C:\Scripts\ProcessCheck.ps1.
Now, for security purposes, we need a user this script can run as. I created a user in our ActiveDirectory service called ‘processcheck’ for this purpose. This user must have ‘Log on as batch job’ rights, which can be setup as follows:
- In the Control Panel, open Administrative Tools, then Local Security Policy.
- Beneath Security Settings, open Local Policies, and highlight User Rights Assignment.
- Locate Log on as a batch job. Open the properties and add the ‘processcheck’ user.
- When finished, save your changes and close the Local Security Settings window.
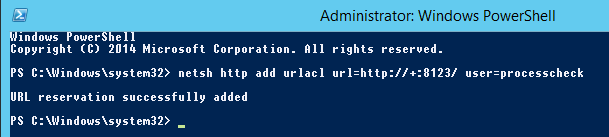
This script will still fail if the user running it does not have permission to listen at the URL it registers to. To work around this, run a PowerShell window ‘As Administrator’ (or as a user with sufficient perms) and run:
netsh http add urlacl url=http://+:8123/ user=processcheck
Next, we need to ensure our monitoring servers can access our endpoint, but the rest of the world cannot. This is done by adding a new rule to the Windows Firewall. The main configuration for the new rule can be seen from the ‘General’ and ‘Ports and Protocols’ tabs…
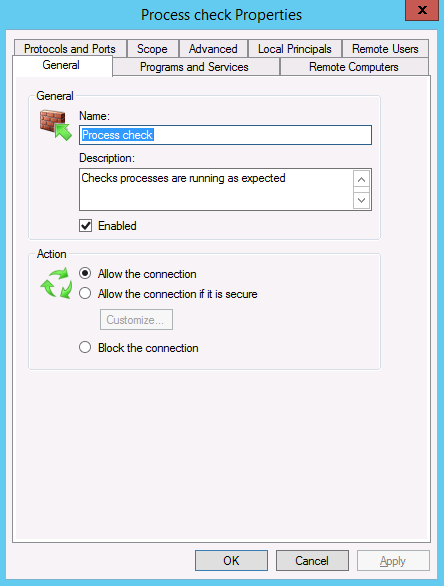
Firewall - General tab
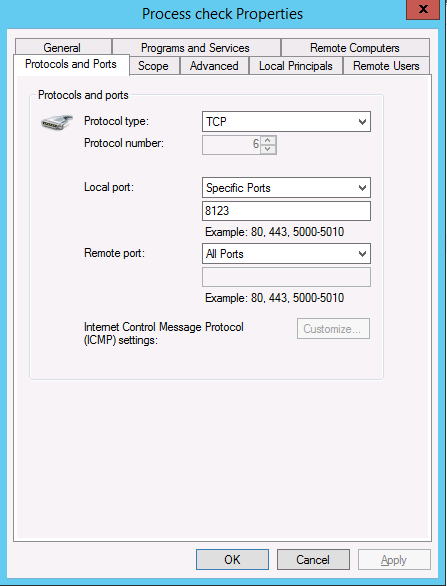
Firewall - Protocols and Ports tab
Now, we need to ensure that this script is running in the background at all times. Typically, you’d do this by running it as a service, but as it’s Powershell, it doesn’t look like that’s simple (possible?) without using a third-party wrapper to provide an ‘.exe’ to interact with that has all the expected properties of a Windows service. Instead, we’re just going to tell Task Scheduler to run it as a recurring process. The theory here is that the script will remain running, and if it dies the scheduler will just restart it automatically within a minute or two.
To create the task, start ‘Task Scheduler’, then ‘Create Task’. The main settings that needed to be configured can be seen in the ‘General’, ‘Actions’ and ‘Settings’ tabs…
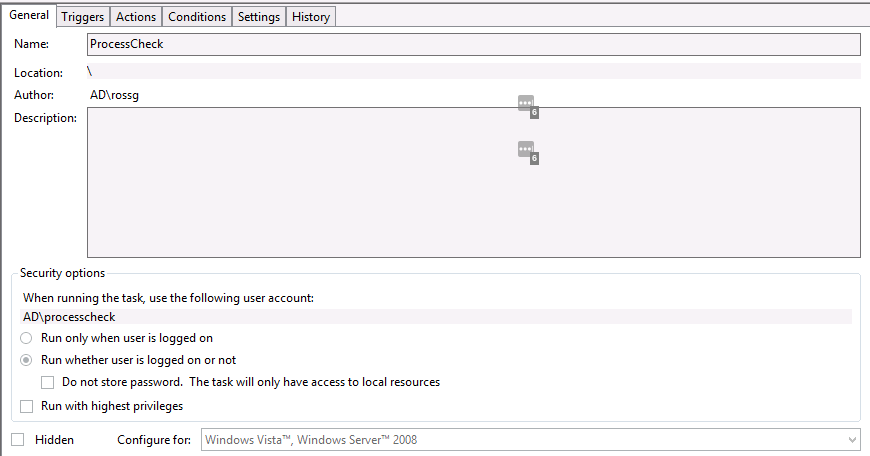
Task Scheduler - General tab
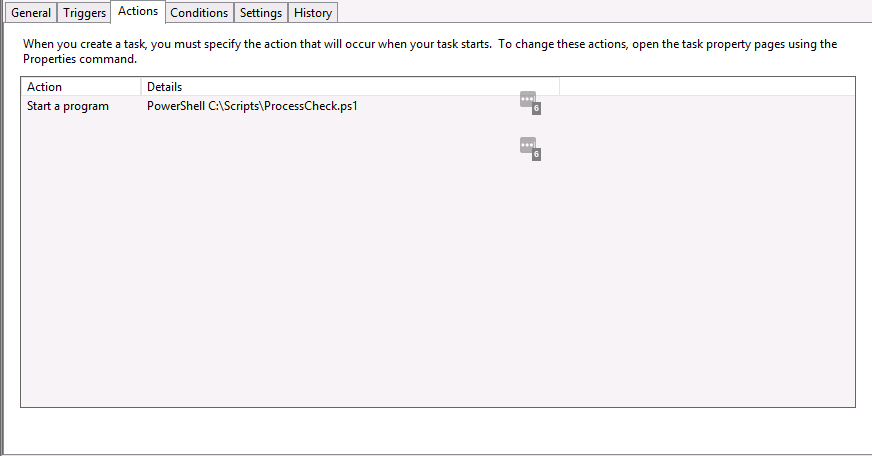
Task Scheduler - Actions tab
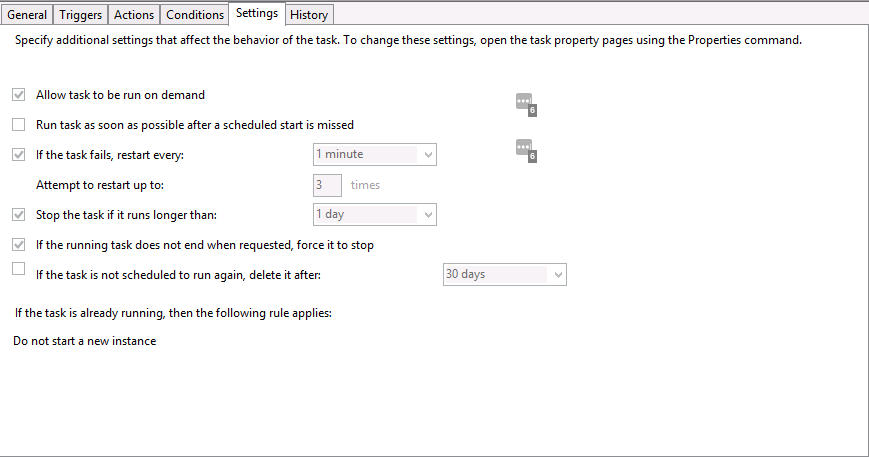
Task Scheduler - Settings tab
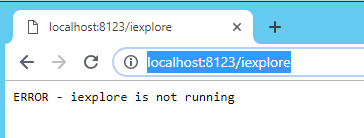
A simple browser-based check on the Windows machine itself confirms that the endpoint is working locally:
Now we should be able to check this using curl from our monitoring servers.
# curl http://host1.ournetwork.lan:8123/iexplore
ERROR - iexplore is not running
So, on to the monitoring server side of things. I will assume you’re using Nagios or a derivative. We use Icinga2, so I’ll give examples using their configuration scheme.
If you’re feeling lazy at this point, you could just configure a basic check_http ensuring the response contains ‘OK’. However, that doesn’t make for a very meaningful error message when the process is not found or an error occurs.
So, best to add a custom check_process command that will make the HTTP call to the endpoint and act on the ‘OK’ or ‘ERROR’ response, or set the service to ‘UNKNOWN’ if it gets an unexpected outcome.
#!/usr/bin/env python3

"""
    Nagios plugin to check status of a process on a remote Windows server
    via a custom URL.
"""

from optparse import OptionParser
import sys
import requests

pluginver = '0.1'

# Parse commandline options:
parser = OptionParser(usage="%prog -h <host_and_port> [ -h ]",version="%prog " + pluginver)
parser.add_option("-H", "--host",
    action="store", type="string", dest="host", help="Host and port")
parser.add_option("-p", "--process",
    action="store", type="string", dest="process", help="Process name")
(options, args) = parser.parse_args()

def main():
    # Check commandline options
    if not options.host:
        print("UNKNOWN: Missing host value (e.g. 'yourhost1.yournetwork.lan:8123').")
        sys.exit(3)
    if not options.process:
        print("UNKNOWN: Missing process name (e.g. 'iexplore').")
        sys.exit(3)

    # Fetch status message
    r = requests.get("http://{}/{}".format(options.host, options.process))
    if r.status_code != 200:
        print("UNKNOWN: Endpoint returned unexpected HTTP status " + str(r.status_code))
        print(r.text)
        sys.exit(3)

    # Parse first line of status message
    l = r.content.decode("utf-8").split('\n')[0]
    if l[0:2] != "OK":
        print(l)
        sys.exit(1)
    else:
        print(l)
        sys.exit(0)

if __name__ == '__main__':
    main()
For the purposes of this blog article, I’ll assume the script has been installed in /etc/icinga2/scripts/check_windows_processand that we are checking hosts for the presence of a running iexplore.exe process. Also, in this case, I am using Icinga2, so you may need to adapt this to your monitoring system.
I’ll start with the command definition:
object CheckCommand "windows-process" {
  import "ipv4-or-ipv6"

  #command = [ PluginDir + "/check_windows_process" ]
  command = [ "/etc/icinga2/scripts/check_windows_process" ]

  arguments = {
    "-H" = {
      value = "$host_address$"
      description = "Hostname (and port) to check (i.e. 'myhost1:8123')"
    }
    "-p" = {
      value = "$process_name$"
      description = "Name of process to check for (i.e. 'iexplore')"
    }
  }

  vars.host_address = "$address$:8123"
  vars.process_name = false
}
Then, a template that can be used by the service definitions:
template Service "application-scheduler" {
    check_command = "windows-process"
    vars.process_name = "MyScheduler2"
    vars.disable_sms_alerts = true
}
You’ll have to fill in the rest according to your specific scenario and needs, but otherwise I hope you find this article useful.